Practical Data Science: How to Easily Rank in Kaggle Beginner NLP Competition Using sklearn

Introduction
Kaggle is an online community and data science competition platform for data scientists, machine learning engineers, and data analysts, featuring many rewarded data science competitions and datasets. The Kaggle community is very famous in the data science field, with many major internet companies publishing rewarded competitions with prizes ranging from tens of thousands to millions of dollars. This article introduces a recent participation in a Kaggle beginner NLP competition, which has no cash rewards but allows learning NLP-related machine learning knowledge.
Competition Overview
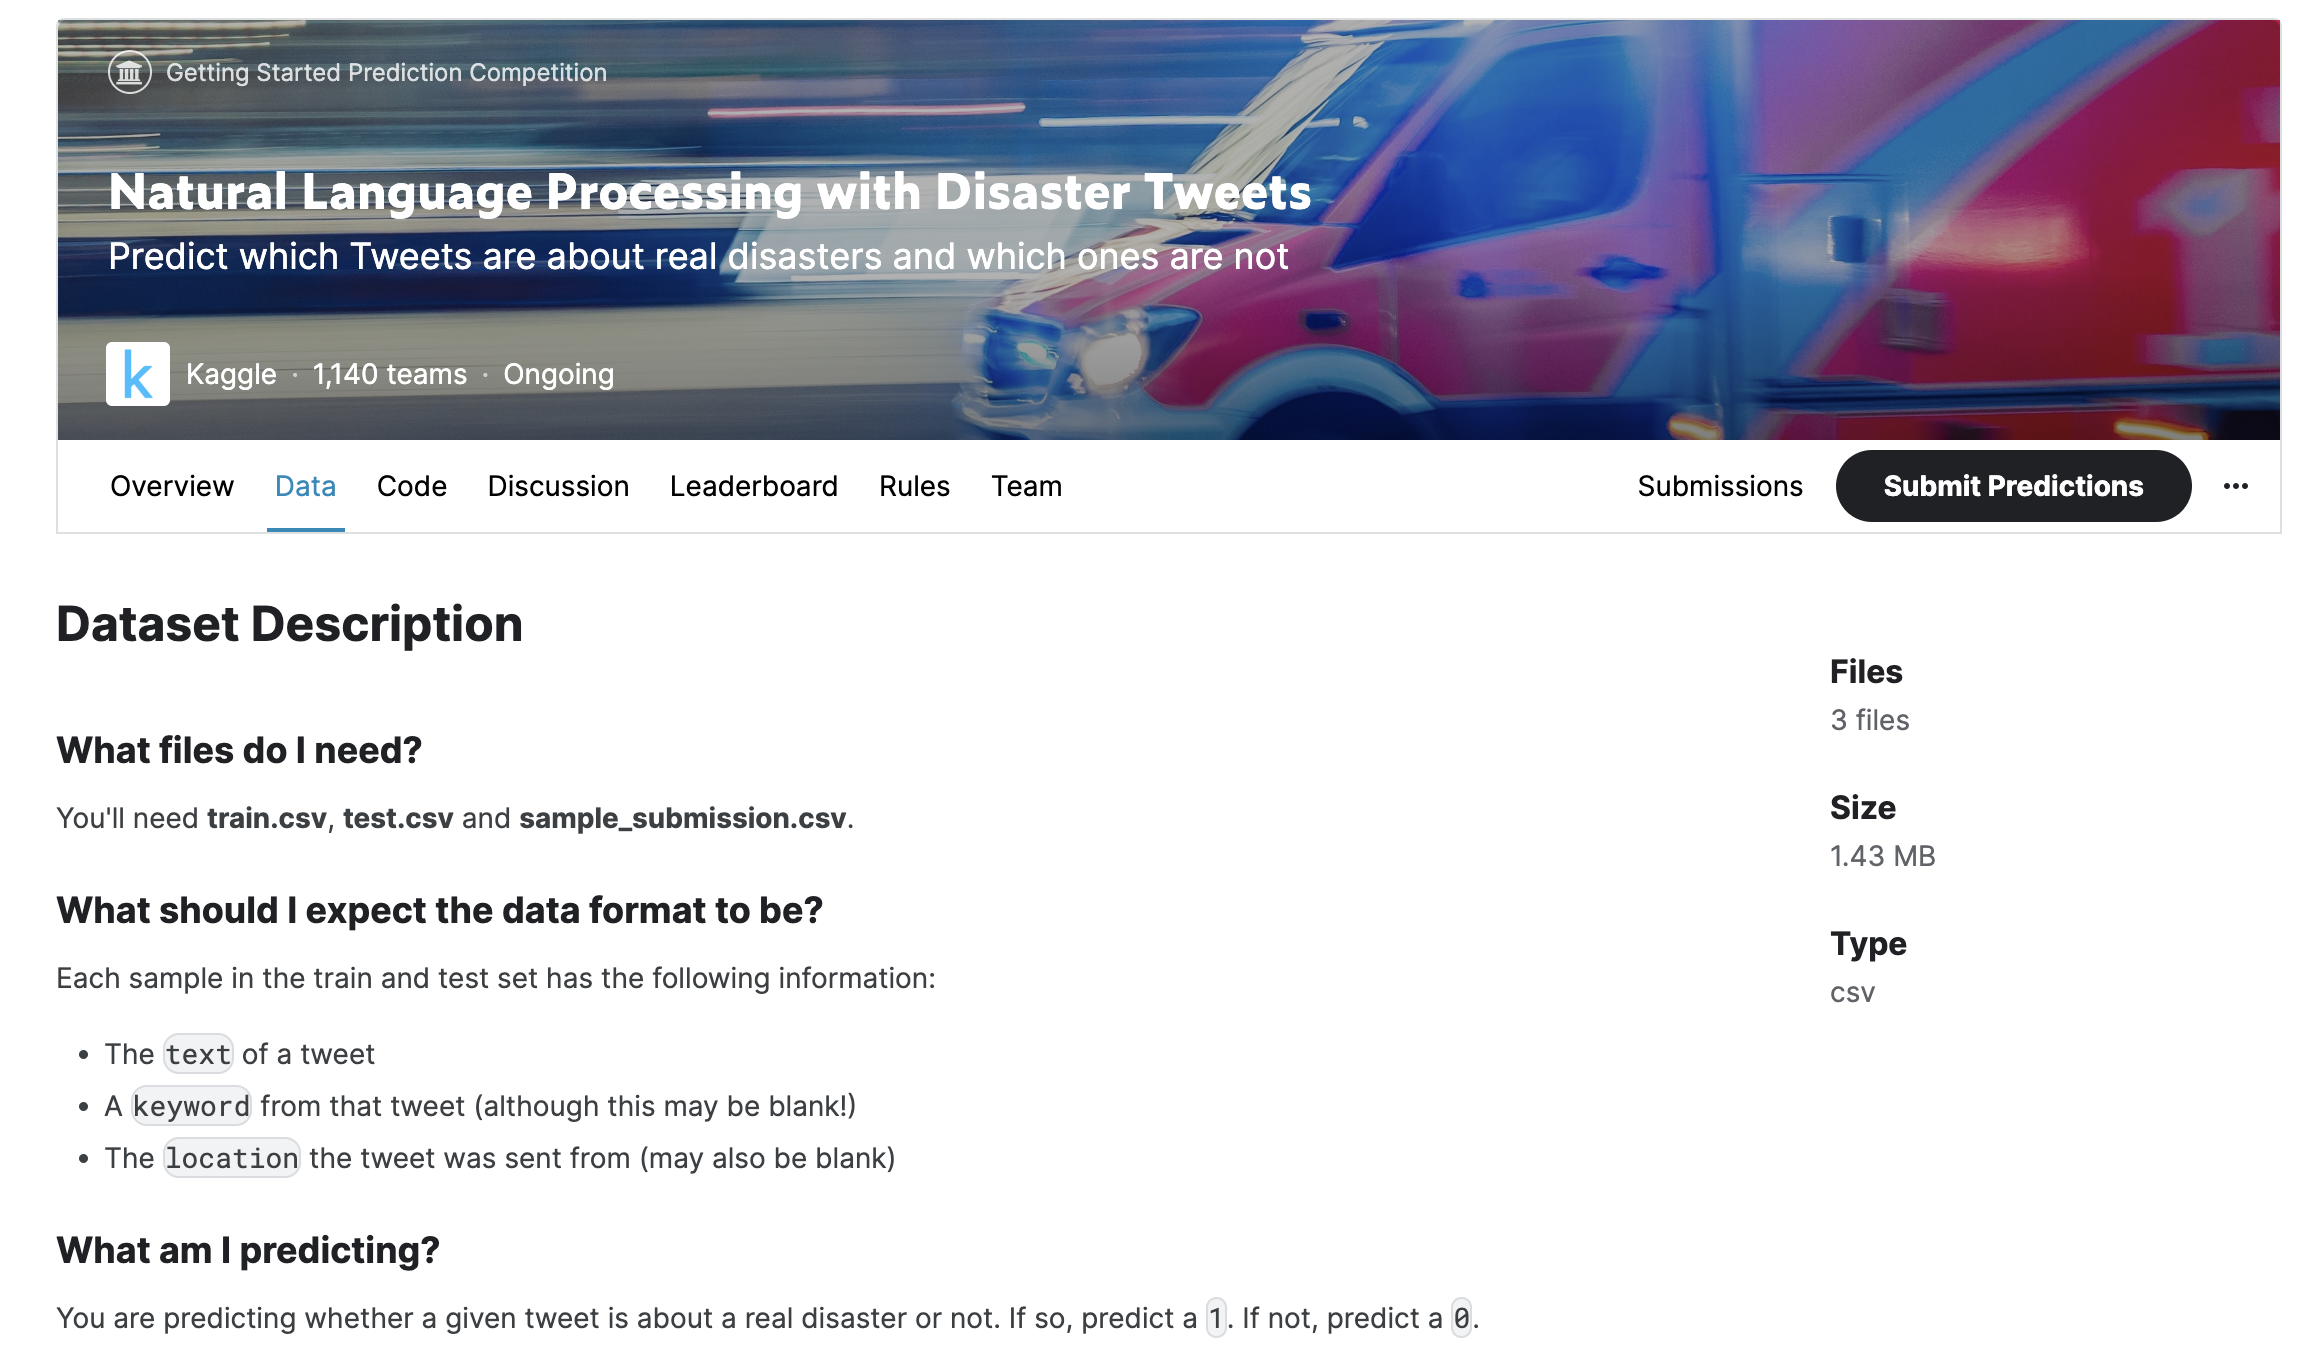
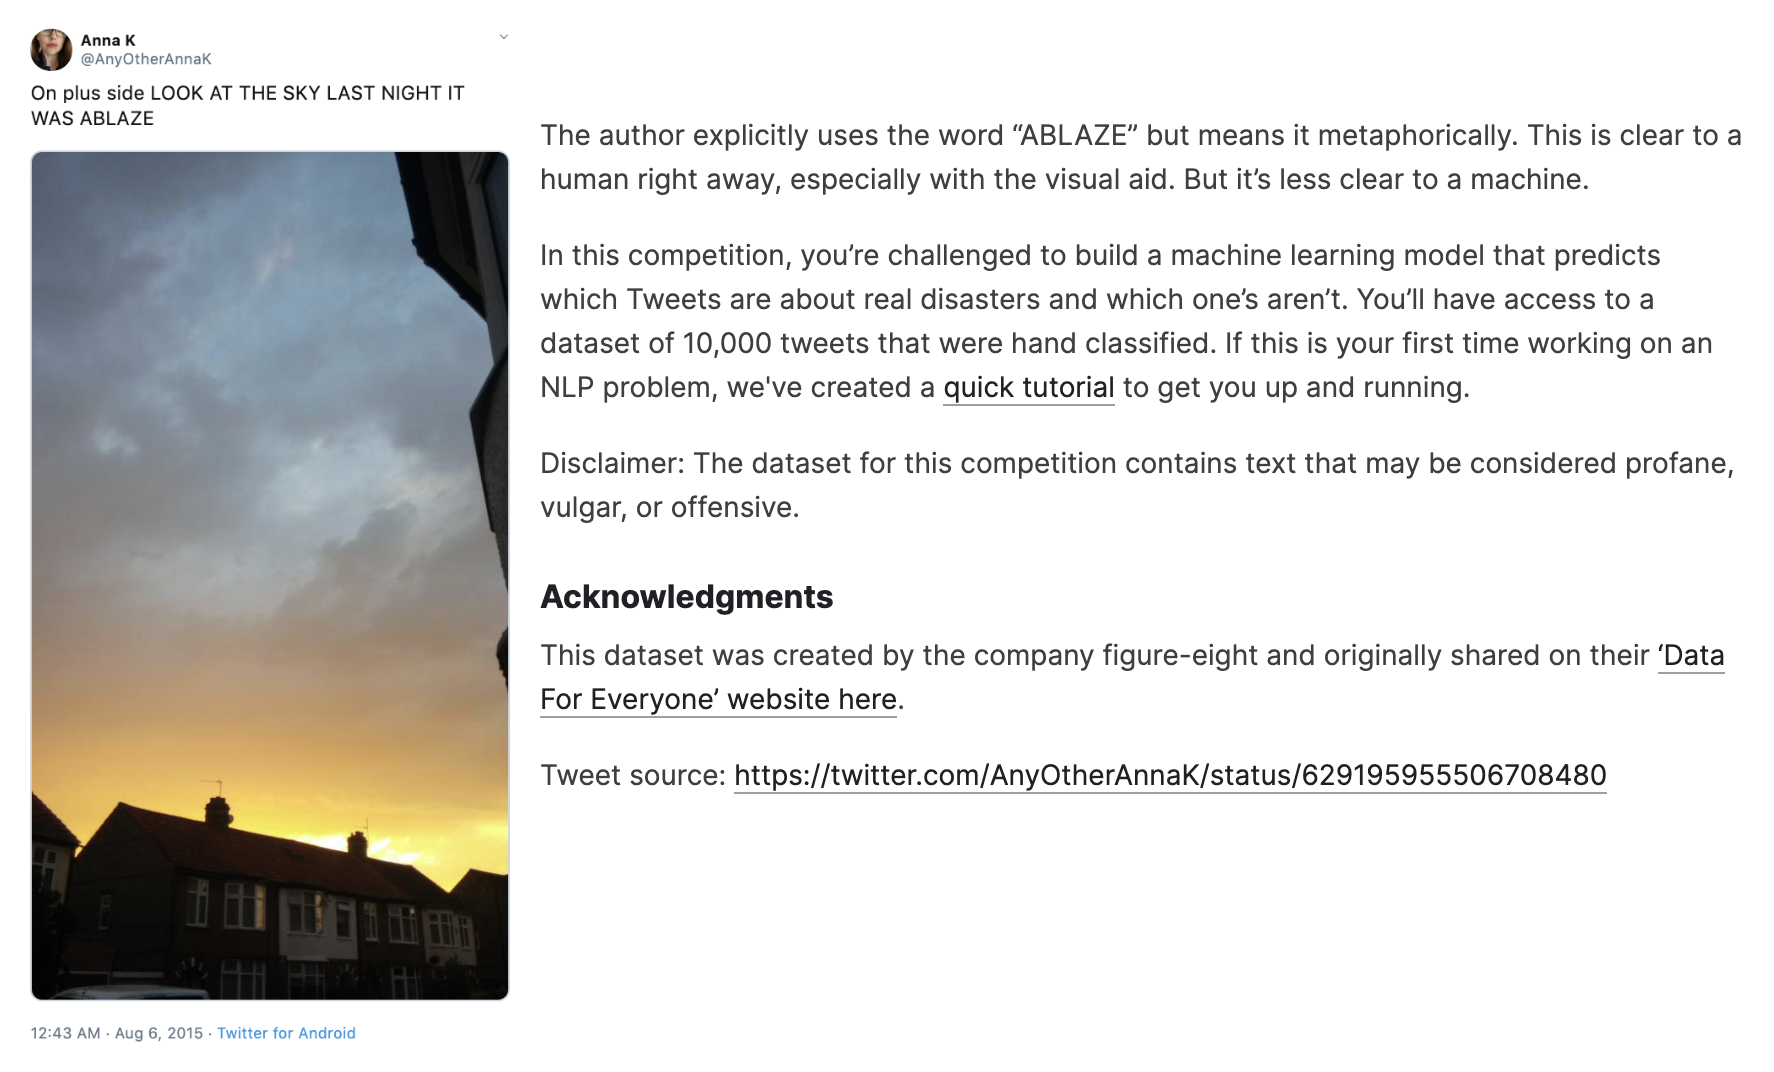
This data science competition asks participants to determine whether a tweet is about a real disaster based on a given Twitter tweet. The image below shows a particular tweet containing the keyword "ABLAZE," indicating the tweet is about a house catching fire.
Dataset and Metrics
Downloading the Dataset
First, we need to download the dataset for analysis and prediction. We go to the dataset URL on the official website Natural Language Processing with Disaster Tweets | Kaggle, click the Data tab, scroll to the bottom right of the page and click the Download button.
The downloaded dataset contains three files:
train.csv: Training data used for analysis and training, containing required training data samples and correct prediction valuestarget(1 indicates a hit, meaning the tweet is about a disaster; 0 indicates not a disaster);test.csv: Similar to training data, containing tweet content but withtargethidden, these are test samples that need to be submitted to Kaggle for prediction competition;sample_submission.csv: Sample submission format, essentially theidcolumn fromtest.csvand the predictedtargetcolumn.
Exploring the Dataset
Although this NLP task analyzes unstructured datasets, we can still use the Pandas library to see what the dataset looks like.
In Jupyter Notebook, we first import the Pandas library to read training and test datasets:
from pandas import read_csv

# load and preview training data
df_train = read_csv('train.csv')
df_train

# load and preview test data
df_test = read_csv('test.csv')
df_test
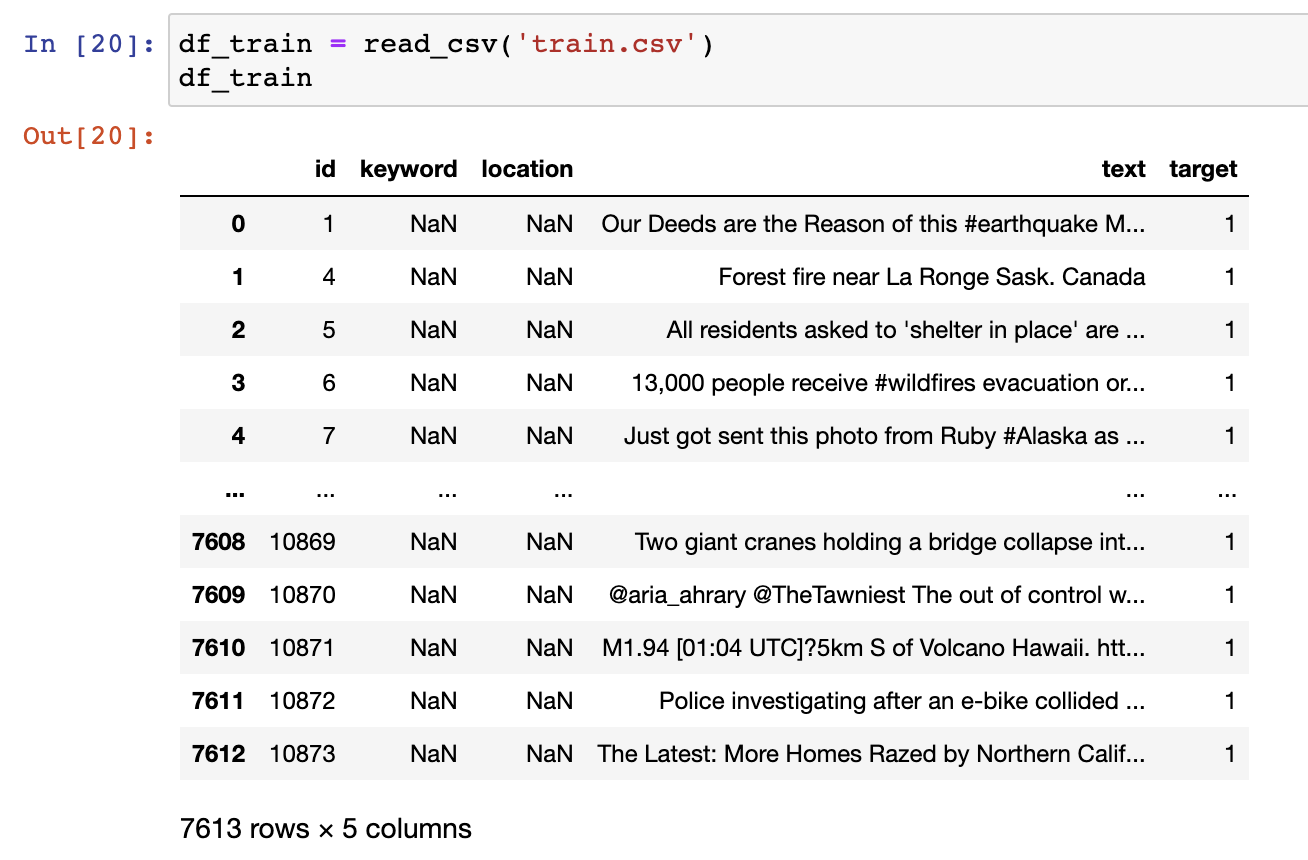
We can see that most content appears to be in the text column. Let's further examine how target is distributed:
# preview target column
df_train.target.value_counts()
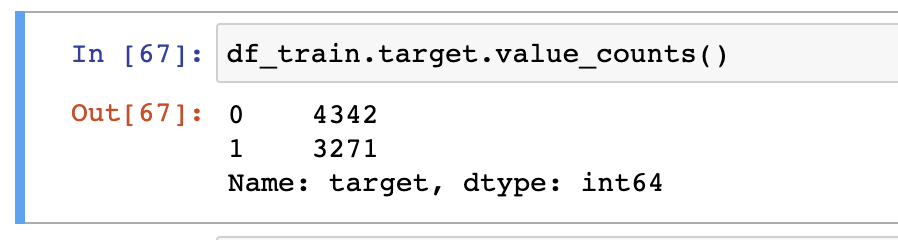
Nearly half of the tweets are judged as disaster-related, i.e., marked as 1.
Let's also look at the other two columns keyword and location to see how many null values NaN there are:
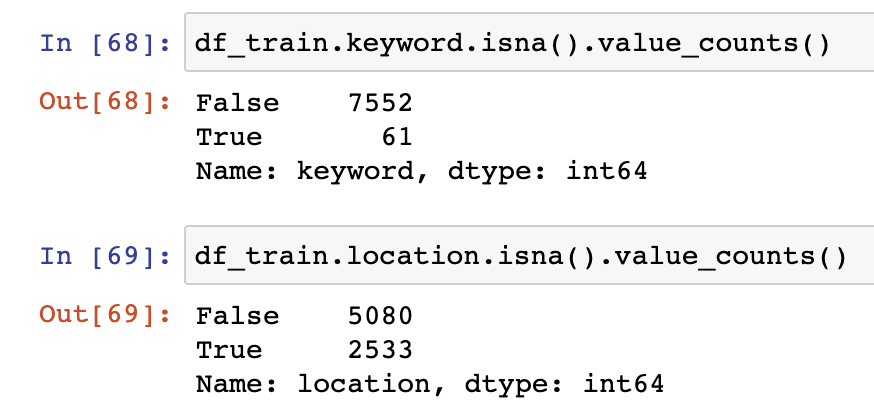
It appears there aren't too many null values.
Converting Text Data
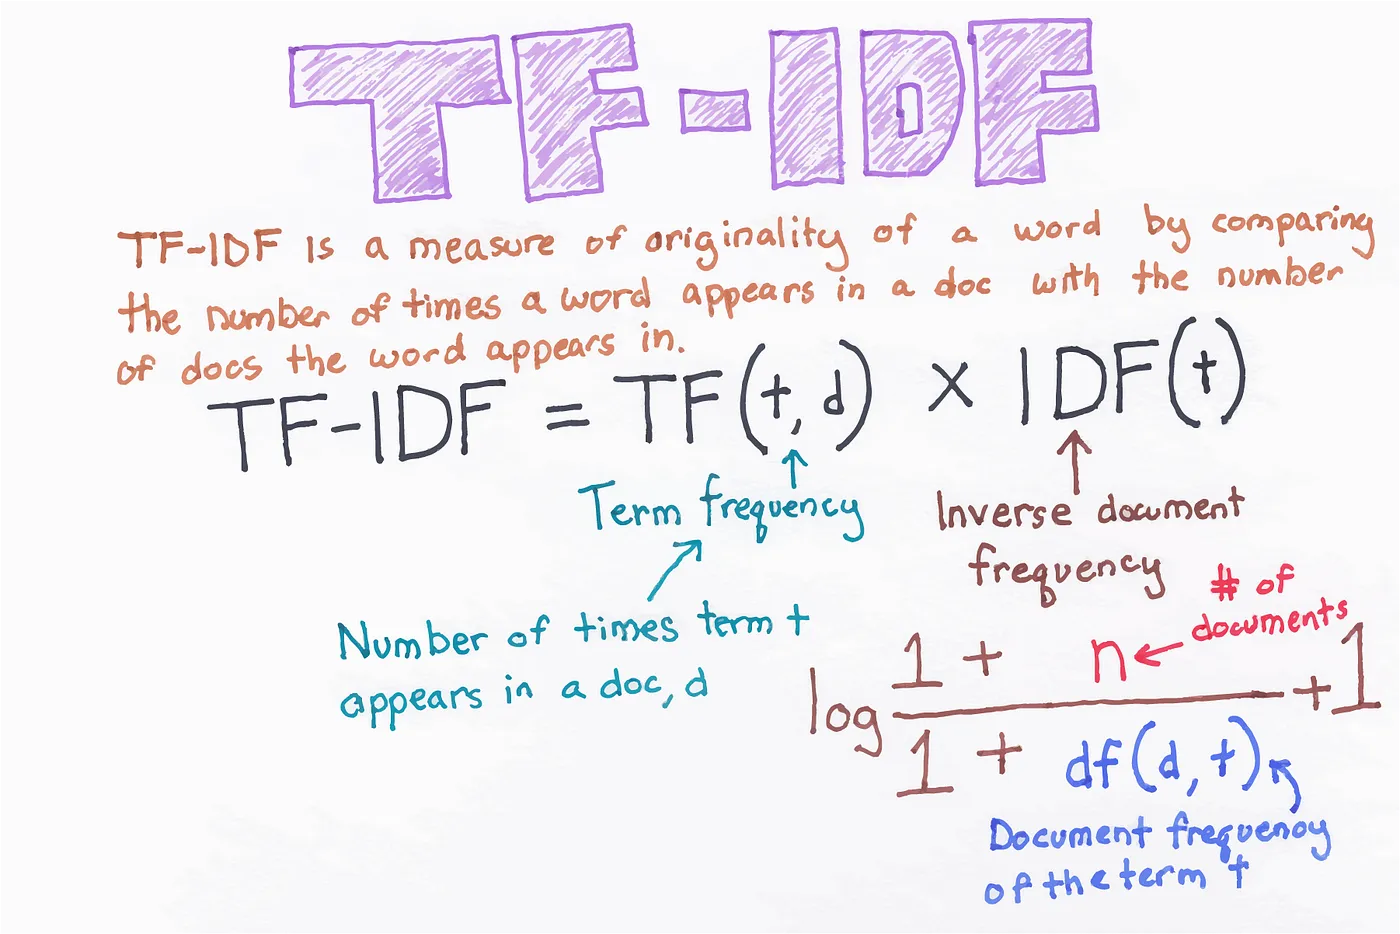
For subsequent modeling and prediction, we need to convert unstructured text data into structured high-dimensional numerical data. For this, we'll use TfidfVectorizer from Scikit-Learn (abbreviated as sklearn). This is a commonly used text feature extraction tool that converts text data into vector representations usable by machine learning algorithms. The classic algorithm used is called TF-IDF, which optimizes keyword weights in text. Simply put, when text appears more frequently, like "this", "the", "a", it indicates less importance, so the weight should be lower; conversely, if a word appears only in one or a few documents (i.e., very rare), it indicates more special characteristics, so the weight should be higher. TF-IDF has exactly these characteristics.
Calling TfidfVectorizer in Python to vectorize documents is also very simple:
import numpy as np
from sklearn.feature_extraction.text import TfidfVectorizer

# vectorizer
vec = TfidfVectorizer()

# fit vectorizer
vec.fit(np.concatenate((df_train.text, df_test.text), axis=0))
Here we merge the text columns from training and test data and feed them into the TF-IDF vectorization instance vec, which automatically tokenizes each text and runs the TF-IDF algorithm.
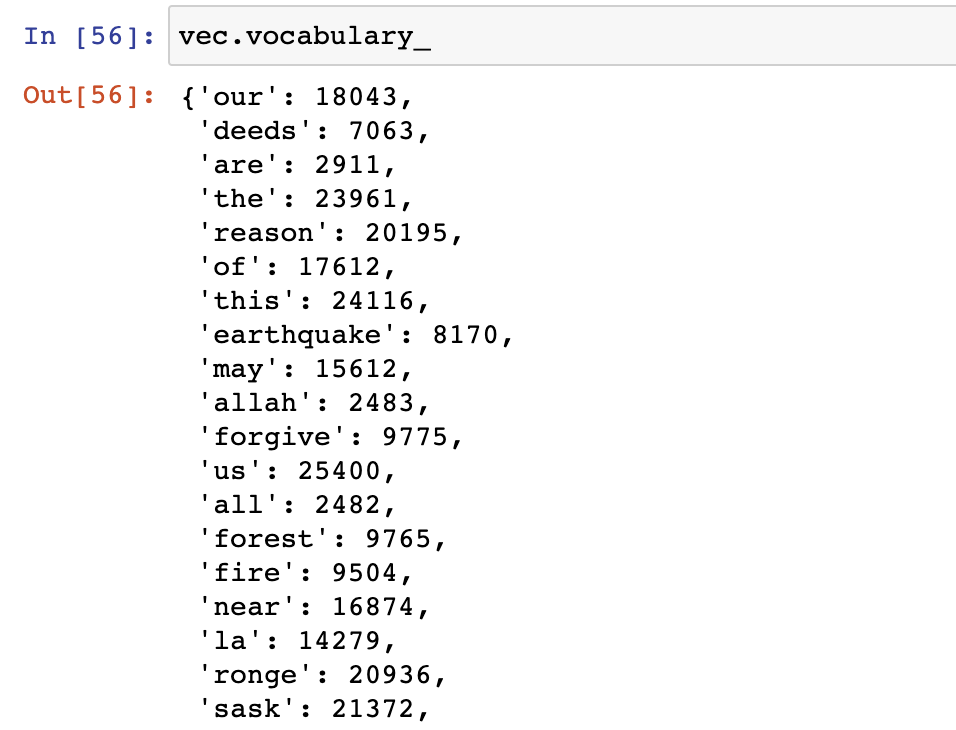
We can look at the vocabulary used:
# preview vocabulary
vec.vocabulary_
Next, we convert text to vectors:
# transform texts into vectors
X_train = vec.transform(df_train.text)
Let's see what X_train is:
# preview X_train
X_train
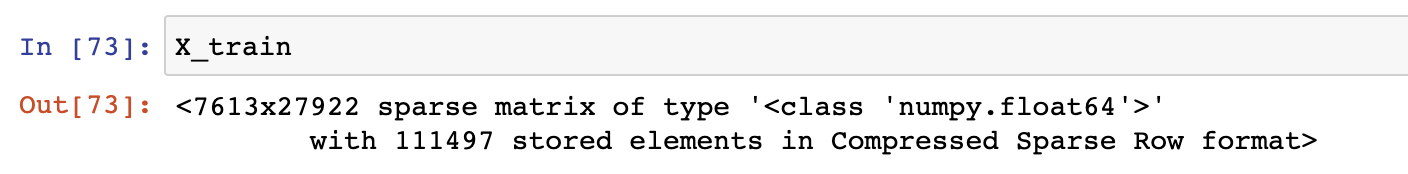
Actually, X_train is a 7613x27922 sparse matrix, where 27922 is the dimension of this dataset, i.e., how many words are used to represent the tweet. This fully demonstrates that text data is high-dimensional data.
Training and Evaluating Data
With data prepared, we can start training and evaluating the training dataset.
First, we define the target vector:
# target vector
y_train = df_train.target
Then, we use the logistic regression classifier LogisticRegression from sklearn for classification prediction. Logistic Regression is a linear model commonly used for binary classification. Using it is also very simple:
from sklearn.linear_model import LogisticRegression

# logistic regression classifier
clf = LogisticRegression()

# fit classifier with training data
clf.fit(X_train, y_train)
This gives us a trained classifier.
Next, we use sklearn's evaluation tool classification_report to evaluate this classifier's performance on its own dataset:
from sklearn.metrics import classification_report

# predict with classifier
y_train_pred = clf.predict(X_train)

# classification report
report = classification_report(y_train, y_train_pred)
print("Classification Report:")
print(report)
After running, we get the classifier's performance report:
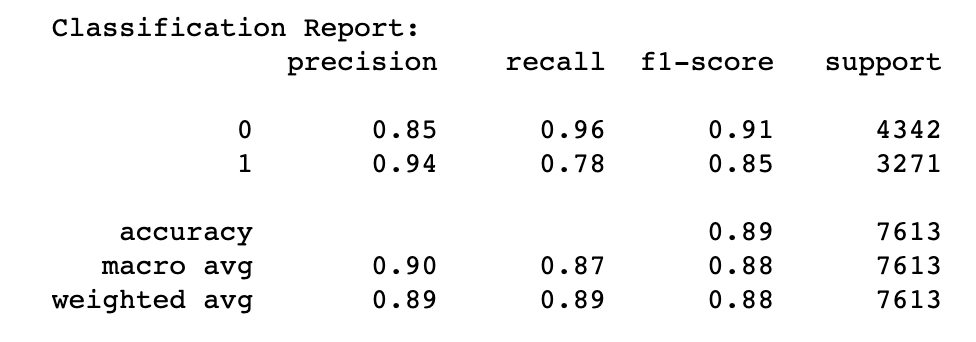
We can see the performance on its own dataset is quite good, achieving 89% accuracy.
Submitting Predictions
Next, we need to submit predictions. All we need to do is run the classifier on the test dataset to get prediction values, generate the corresponding CSV file, and upload it to the Kaggle competition:
# transform text to vector (test data)
X_test = vec.transform(df_test.text)

# predict target (test data)
y_test_pred = clf.predict(X_test)

# assign target column (test data)
df_test['target'] = y_test_pred

# generate submission csv file
df_test[['id', 'target']].to_csv('submission.csv', index=False)
Then, we upload the generated submission.csv file to the Kaggle competition and immediately get scoring results:
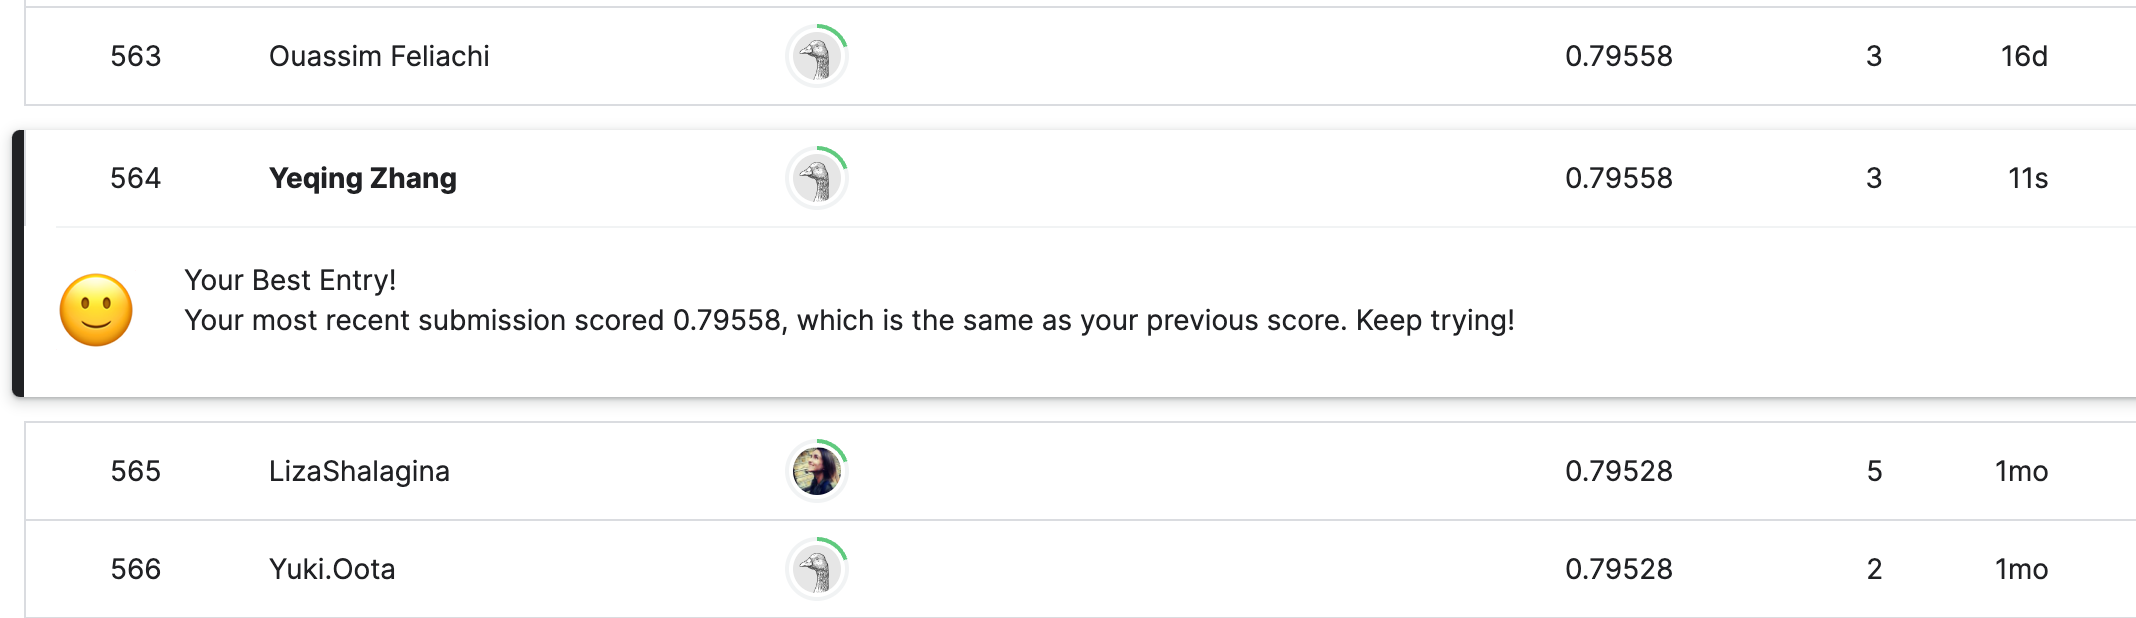
Great! We achieved 0.79558 accuracy, ranking around 50%, which means we beat half of our competitors.
Summary
Through simple use of TF-IDF text vectorization and logistic regression classifier on tweet datasets, we achieved approximately 80% accuracy, which is already quite good! Note that we haven't even used some fields yet. To improve results, we should use the keyword field and hashtags in tweets (like #wildfire), which weren't used in this competition attempt. I tried classifiers other than logistic regression, such as naive Bayes classifier, which worked on the training set but didn't score well on the test dataset. There are many other interesting competitions on Kaggle that interested readers can try participating in.
Community
If you're interested in my articles, you can add my WeChat tikazyq1 with note "码之道" (Way of Code), and I'll invite you to the "码之道" discussion group.